HowTo: Use diginsight telemetry with no impact on Application performance and telemetry cost
Introduction
Diginsight brings application behavior observability to the next step.
In particular The full application flow is made available to local text based streams such as the Console log or the Streaming log.
The same information can be made available to remote tools for troubleshooting or performance analysis such as Azure Monitor or Grafana.
The following example shows the execution flow of a Web API call, .
The call shows a REST http call landing on PlantsController.GetPlantsAsync() method in turn invoking a api/Users/getUsers endpoint on an external endpoint.
than calling a PlantsController.GetPlantsImplAsync() method in a loop.
The following image shows the same call log4net file log with full detail of the call flow.
: 
In the following paragraphs we’ll understand how this observability can be obtained without impact on the application performance.
Also, you will soon learn that diginsight can be of great help with identifying and reducing high latency flows and redundant flows within the application execution paths.
So diginsight can greatly contribute to application performance optimization more than provide a limitation to it. > >With article: GETTING STARTED
We explore how we can make our application flow fully observable.
Performance considerations
The following image defines key drivers used by diginsights to avoid performence impacts: 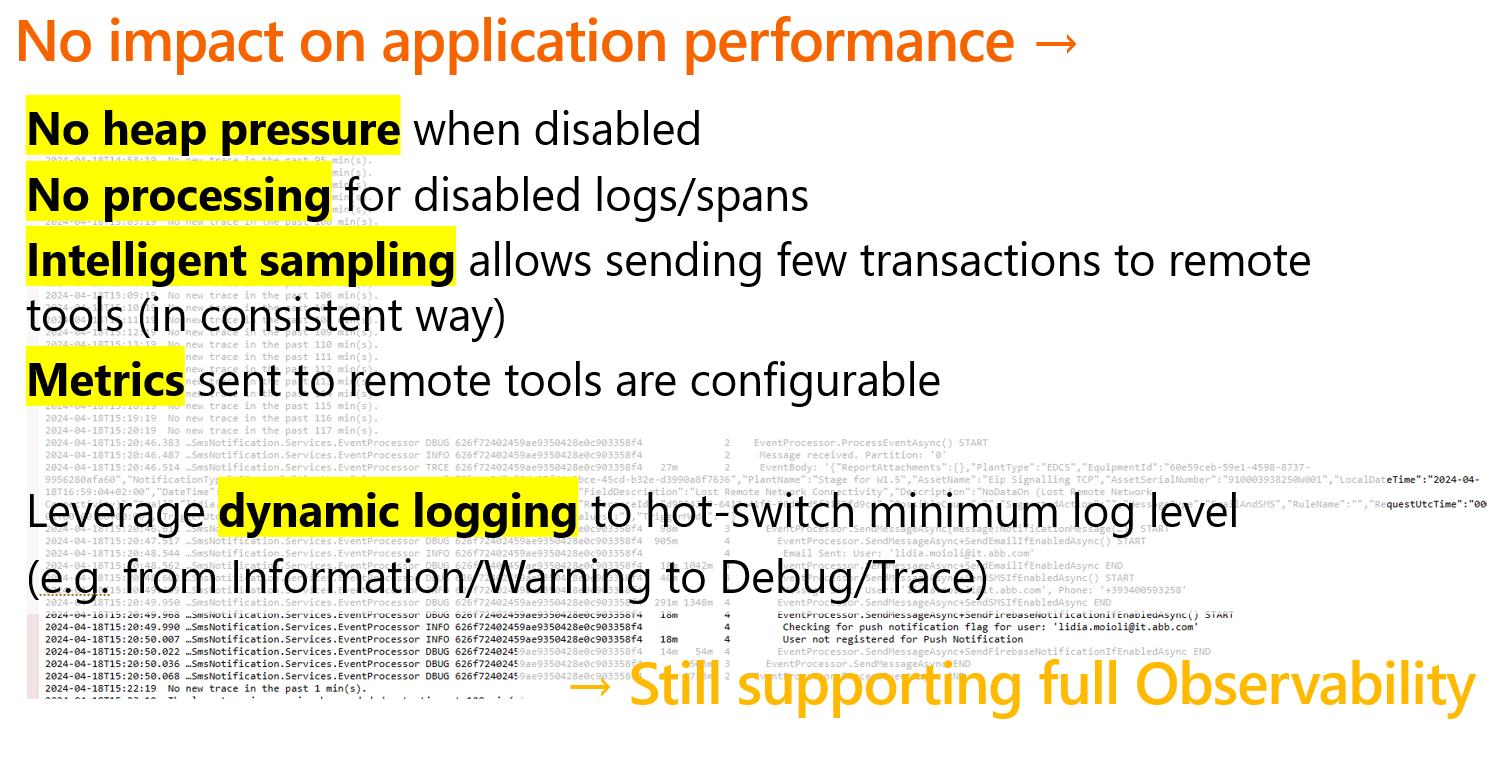
Driver n°1: No heap pressure when disabled
The following code snippet shows a method instrumented by means of diginsight System.Diagnostics activities:
public async Task<IEnumerable<Plant>> GetPlantByIdCachedAsync(Guid id)
{
    using var activity = Program.ActivitySource.StartMethodActivity(logger, () => new { id });

    // Method implementation
    // ...

    activity?.SetOutput(plants);
    return plants;
}
When disabling an activity source, the activities for it are not created and StartMethodActivity returns null.
Also, if delegate notation is used to provide the StartMethodActivity payload, in case logging or payload rendering are disabled, the delegate is not used and the payload class is not allocated into the heap.
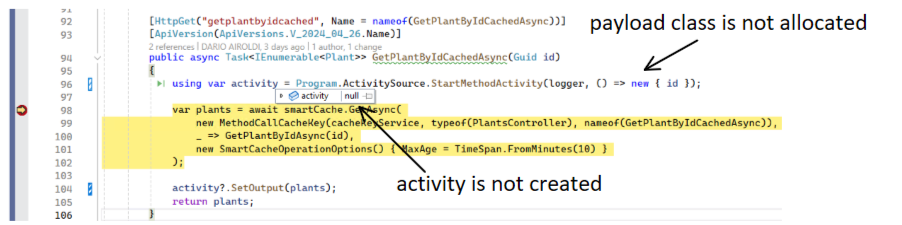
In such conditions, diginsight activities are not at all generated or used and do not provide any performance impact to the overall application.
Driver n°2: No processing for disabled logs
Needless to say, when log is disabled, method payloads are not processed at all and no strings are generated for method spans start and completion.
Also intermediate logger.LogXxxx() statements, when using structured logging notation do not involve any string composition.
public async Task<IEnumerable<Plant>> GetPlantByIdCachedAsync(Guid id)
{
    using var activity = Program.ActivitySource.StartMethodActivity(logger, () => new { id });

    // Method implementation
    // ...
    logger.LogInformation("Plant '{Name}' ({Id}) accessed", plant.Name, plant.Id)

    activity?.SetOutput(plants);
    return plants;
}
Driver n°3: Intelligent sampling can be used to limit data sent to the remote tools
Diginsight supports intelligent sampling by means of OpenTelemetry sampling support.
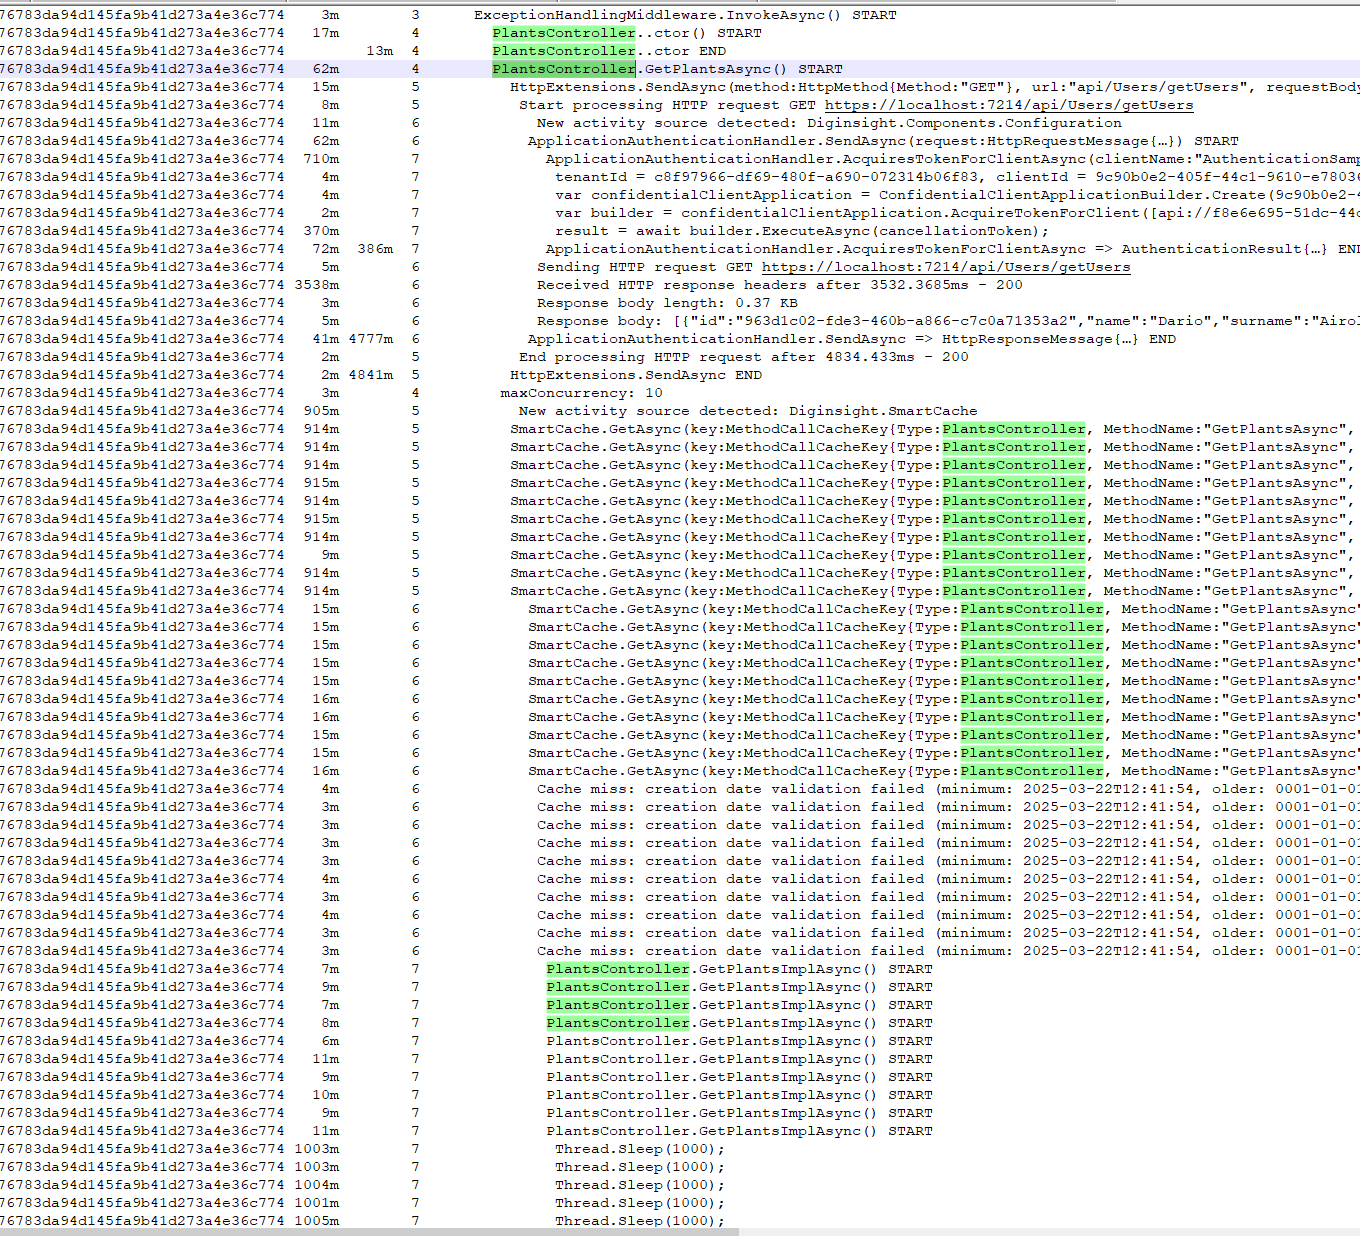
With OpenTelemetry, a full execution within a component is identified as a trace.
The image below shows an example trace where all rows share the same trace_id.
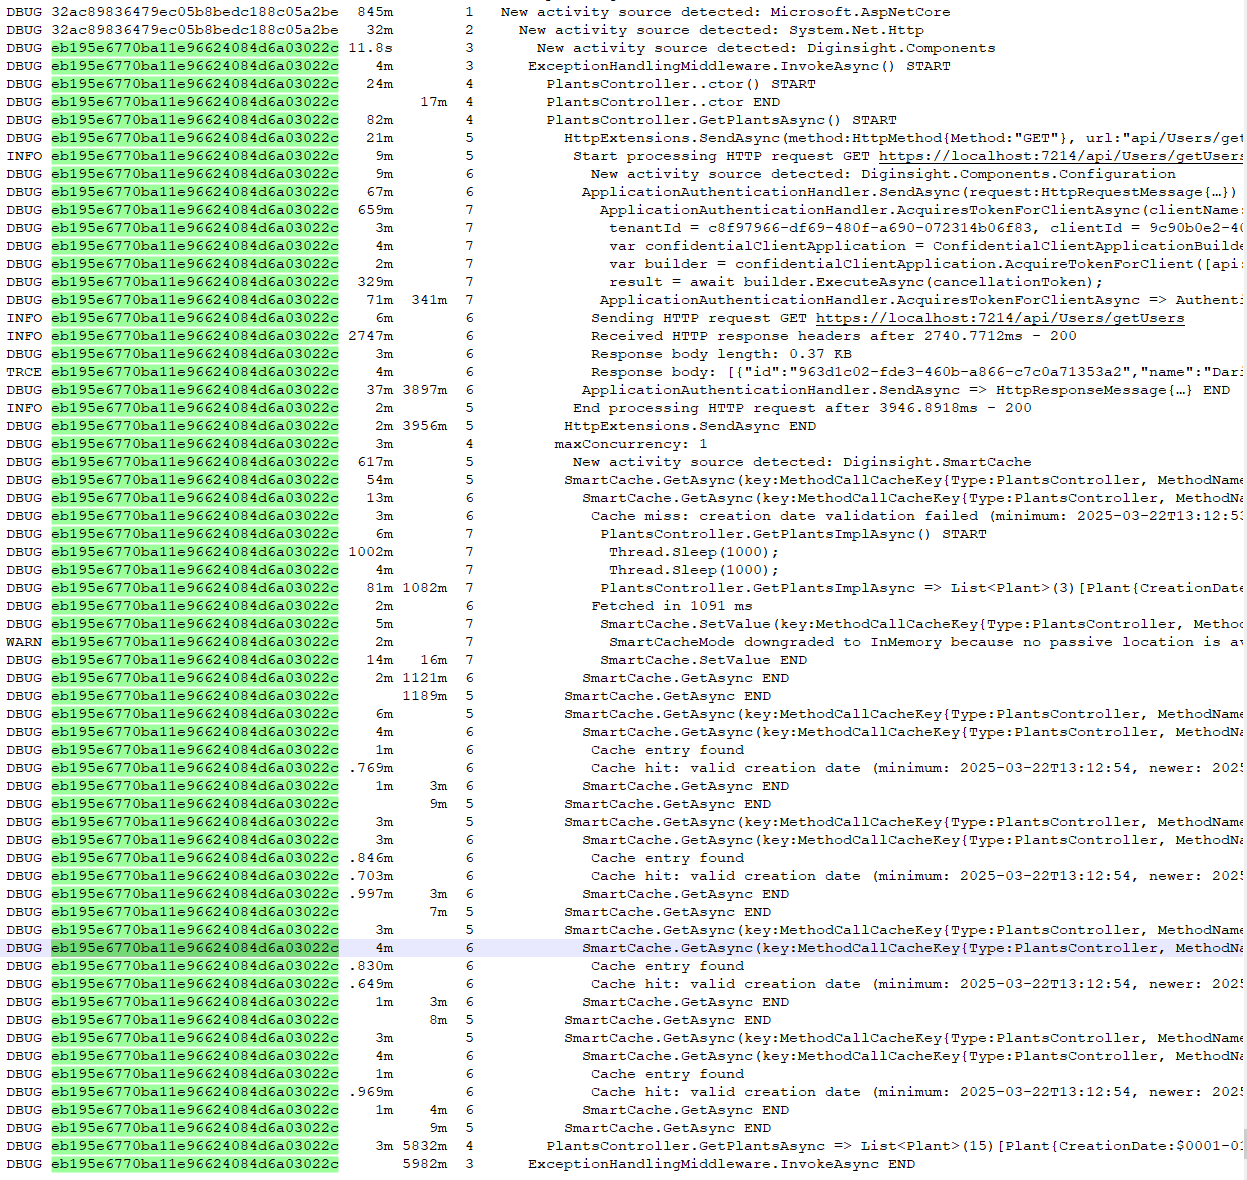
When an exevution flow is selected for sending to the remote tools, all the rows within the flow are sent.
When an exevution flow is omitted, all the rows within the flow are omitted.
This way. consistency and readability of data sent to the remote tools is ensured.
Also, data sent to the remote tools can be limited in size, as well as its cost and performance impact.
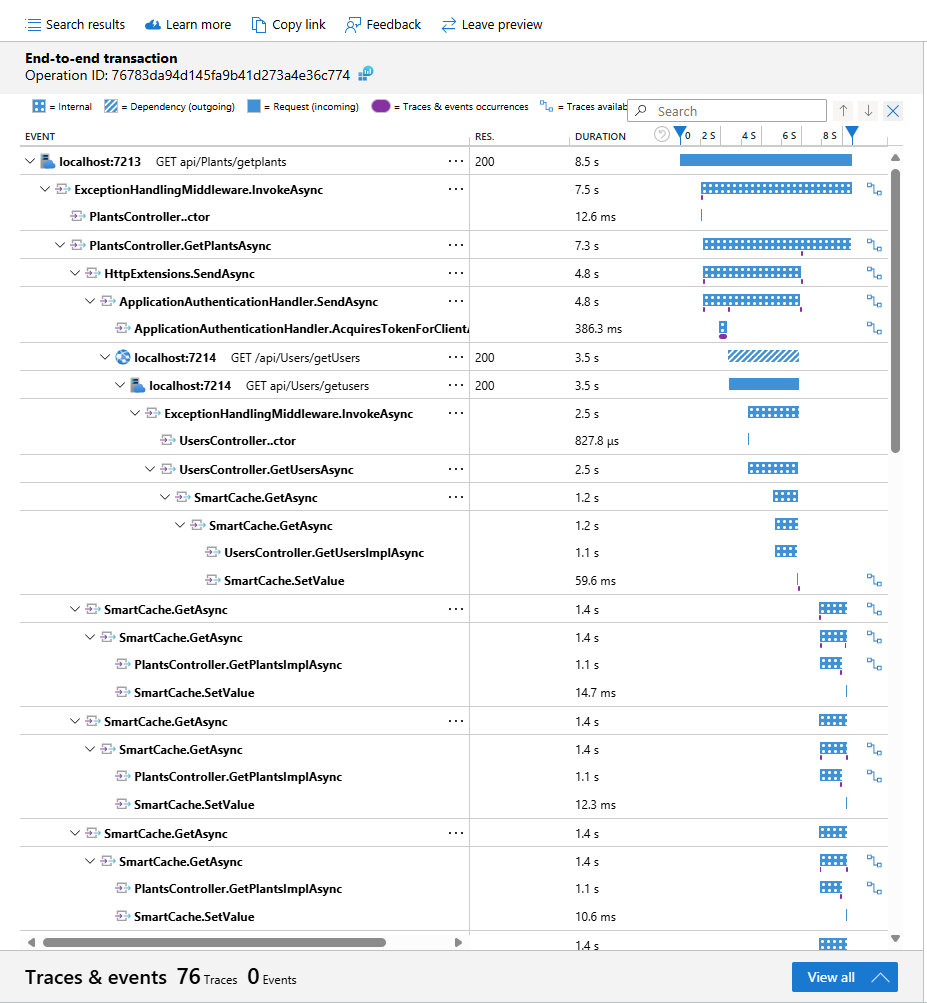
The image below shows an end to end transation detail sent to the Azure Monitor:
All the transaction flow is sent, regardless of the sampling ratio configured for the application. 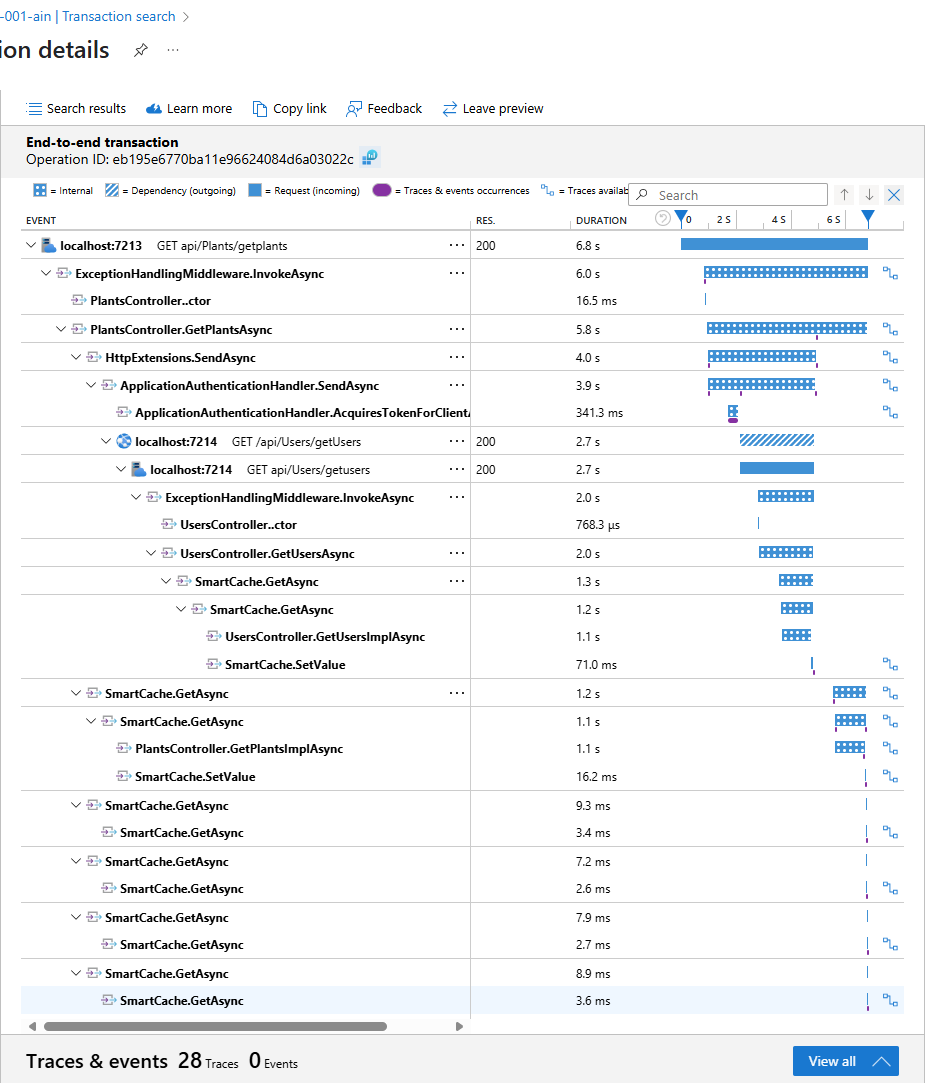
The configuration section below, specifies a "TracingSamplingRatio": 0.1.
In such case, only one execution flow should be sent to the remote tools, out of 10.
  "OpenTelemetry": {
    "EnableTraces": true,
    "EnableMetrics": true,
    "AzureMonitorConnectionString": "",
    "TracingSamplingRatio": 0.1,
    "ActivitySources": [
      "Azure.Cosmos.Operation",
      "Azure.Storage.Blobs.BlobBaseClient",
      "Microsoft.AspNetCore",
      "Diginsight.*",
      "S01_02_SampleWebAPIWithOpentelemetry"
    ],
    "Meters": [
      "S01_02_SampleWebAPIWithOpentelemetry"
    ],
    "ExcludedHttpHosts": [
      "login.microsoftonline.com",
      ".documents.azure.com",
      ".applicationinsights.azure.com",
      ".monitor.azure.com",
      ".b2clogin.com"
    ],
    "DurationMetricTags": [
      "widget_template",
      "site_name"
    ]
  },
On a production environment you may choose to keep a default Sampling Ratio from 0.1 to 0.4 to ensure minimal telemetry volumes and cost still allowing systems behaviours analysis (eg. average Latencies, metrics dashboards etc).
Dynamic Logging and Dynamic configuration can be used to act on this parameter, for limited intervals or for specific execution flows, without need of application restart.
This will ensure Full troubleshooting support.
it is perfectly feasible to operate on a production environment keeping telemetry cost below a threshold (eg. in our case we work at about 5%) of the overall infrastructure cost, still ensuring full observability for troubleshooting of production issues.
Driver n°4: Traces sent to the remote tools are higly configurable
Data sent to the remote tools can be configured by means of the OpenTelemetry section:
"OpenTelemetry": {
    "EnableTraces": true,
    "EnableMetrics": true,
    "AzureMonitorConnectionString": "",
    "TracingSamplingRatio": 0.1,
    "ActivitySources": [
        "Azure.Cosmos.Operation",
        "Azure.Storage.Blobs.BlobBaseClient",
        "Microsoft.AspNetCore",
        "Diginsight.*",
        "S01_02_SampleWebAPIWithOpentelemetry"
    ]
},EnableMetrics(def. true): specifies whether metrics are sent to the remote toolsEnableTraces(def. true): specifies whether traces are sent to the remote toolsTracingSamplingRatio(def. 1): specifies the sampling ratio for data sent to the remote tools.ActivitySources: identifies the activity sources enabled for sending data to the remote tools.
Driver n°5: Metrics sent to the remote tools are higly configurable
With OpenTelemetry, every execution flow (trace) can be composed of multiple spans.
Diginsight gathers automatically few simple metrics such as the diginsight.span_duration that describes every single method latency.
The local troubleshooting tools show the diginsight.span_duration metric at any span completion row: 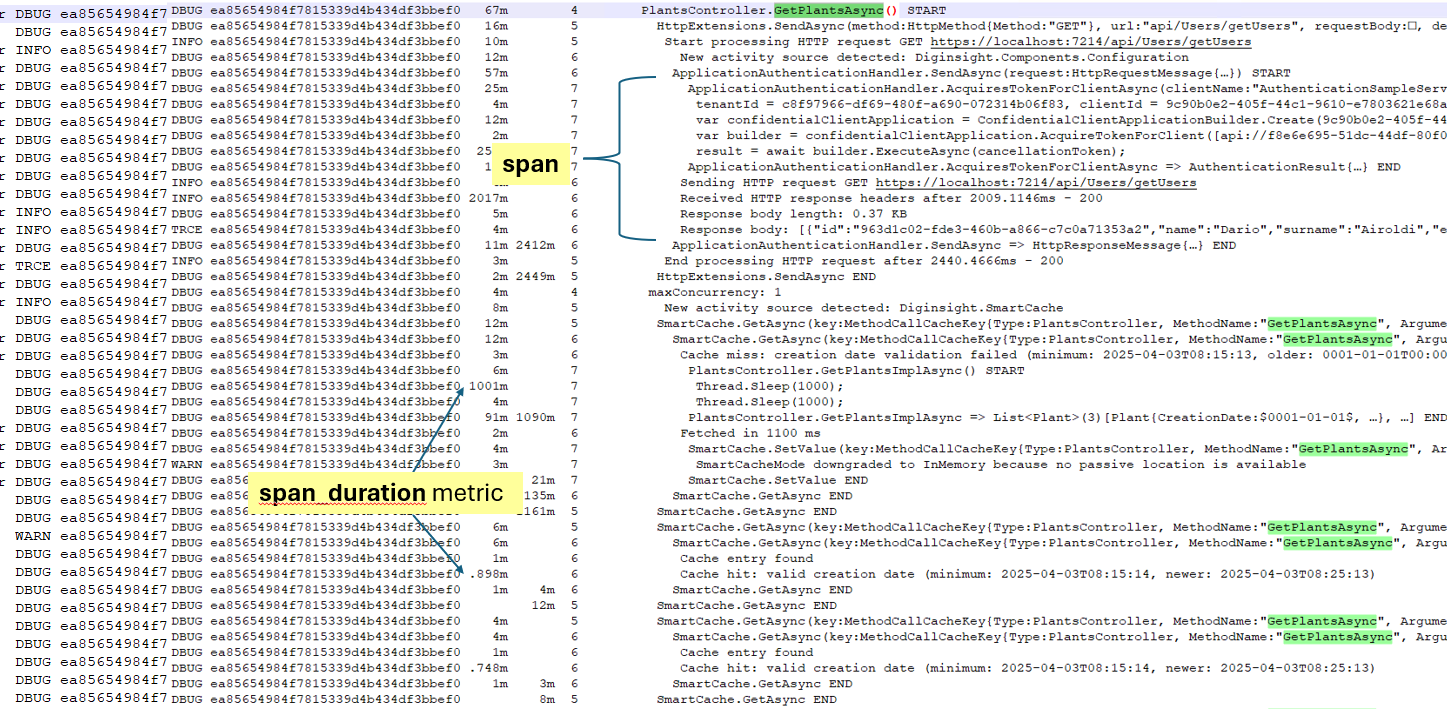
Diginsights can be configured to send the span_duration metric to the remote tools.
The following charts show diginsight span_duration metric for a few methods on an Azure Monitor dashboard:
| span_duration kql query | span_duration chart |
|---|---|
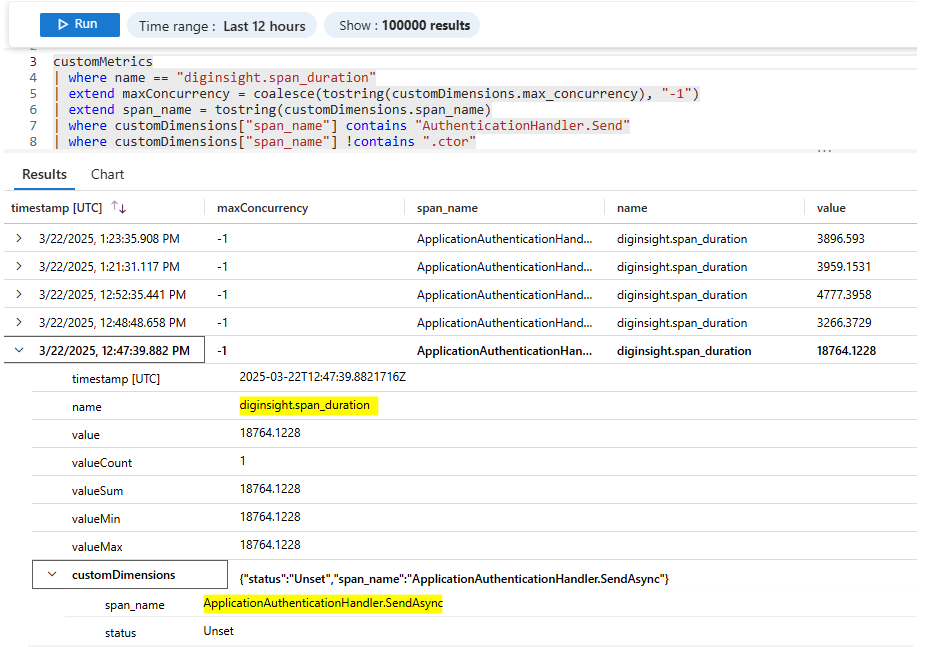 |
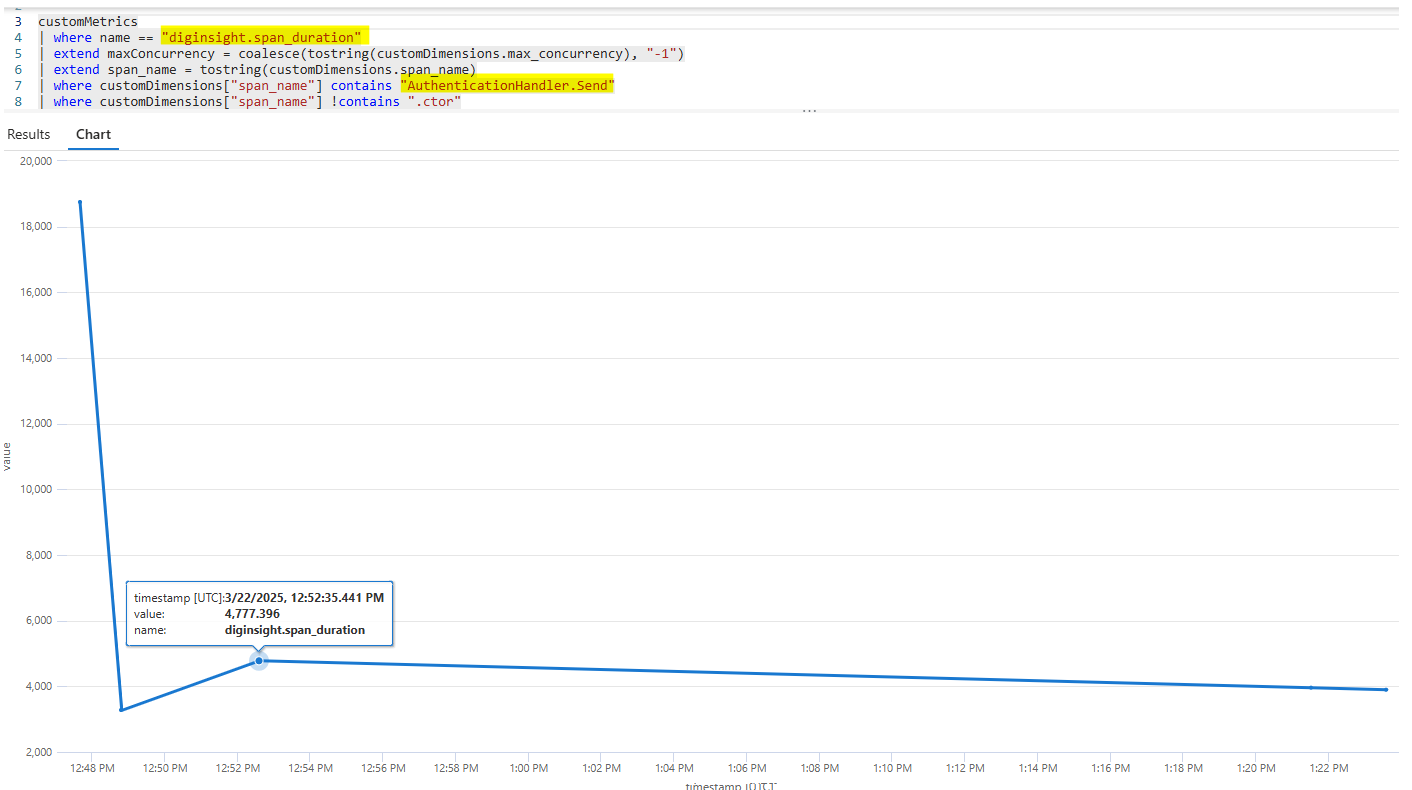 |
RecordSpanDurations class aware option can be used to specify specific methods for which span_duration metric should be sent to the remote tools.
In particular, the RecordSpanDurations flag can be set at namespace or class granularity level.
As an example, the configuration snippet below specifies that RecordSpanDurations flag is enabled only for Microsoft and Diginsight namespaces:
"Diginsight": {
    "Activities": {
        "RecordSpanDurations": false,
        "RecordSpanDurations@Microsoft.*": true,
        "RecordSpanDurations@Diginsight.*": true
    }
}
Driver n°6: Use Request level dynamic Logging to hot switch log levels on local troubleshooting tools
With diginsight, you can safely send sampled telemetry to the remote troubleshooting tools.
This allows capturing application behaviors and trends.
Also, logging to the local troubleshooting tools can normally be kept at Warning or Information level.
This way, only limited information is sent to the remote tools and also, limited information is written to the local troubleshooting tools.
The snippet below shows a normal configuration for a runtime environment where only Information or warning level is enabled for few logging categories:
"Logging": {
  "LogLevel": {
    "Default": "Warning",
    "Microsoft": "Warning",
    "Microsoft.Hosting.Lifetime": "Information",
    "Diginsight.SmartCache.Externalization.ServiceBus": "Warning",
    "*.BodyLoggingHandler": "Warning"
  }
},
The image below shows an application streaming log where only limited information is written about exceptional conditions: 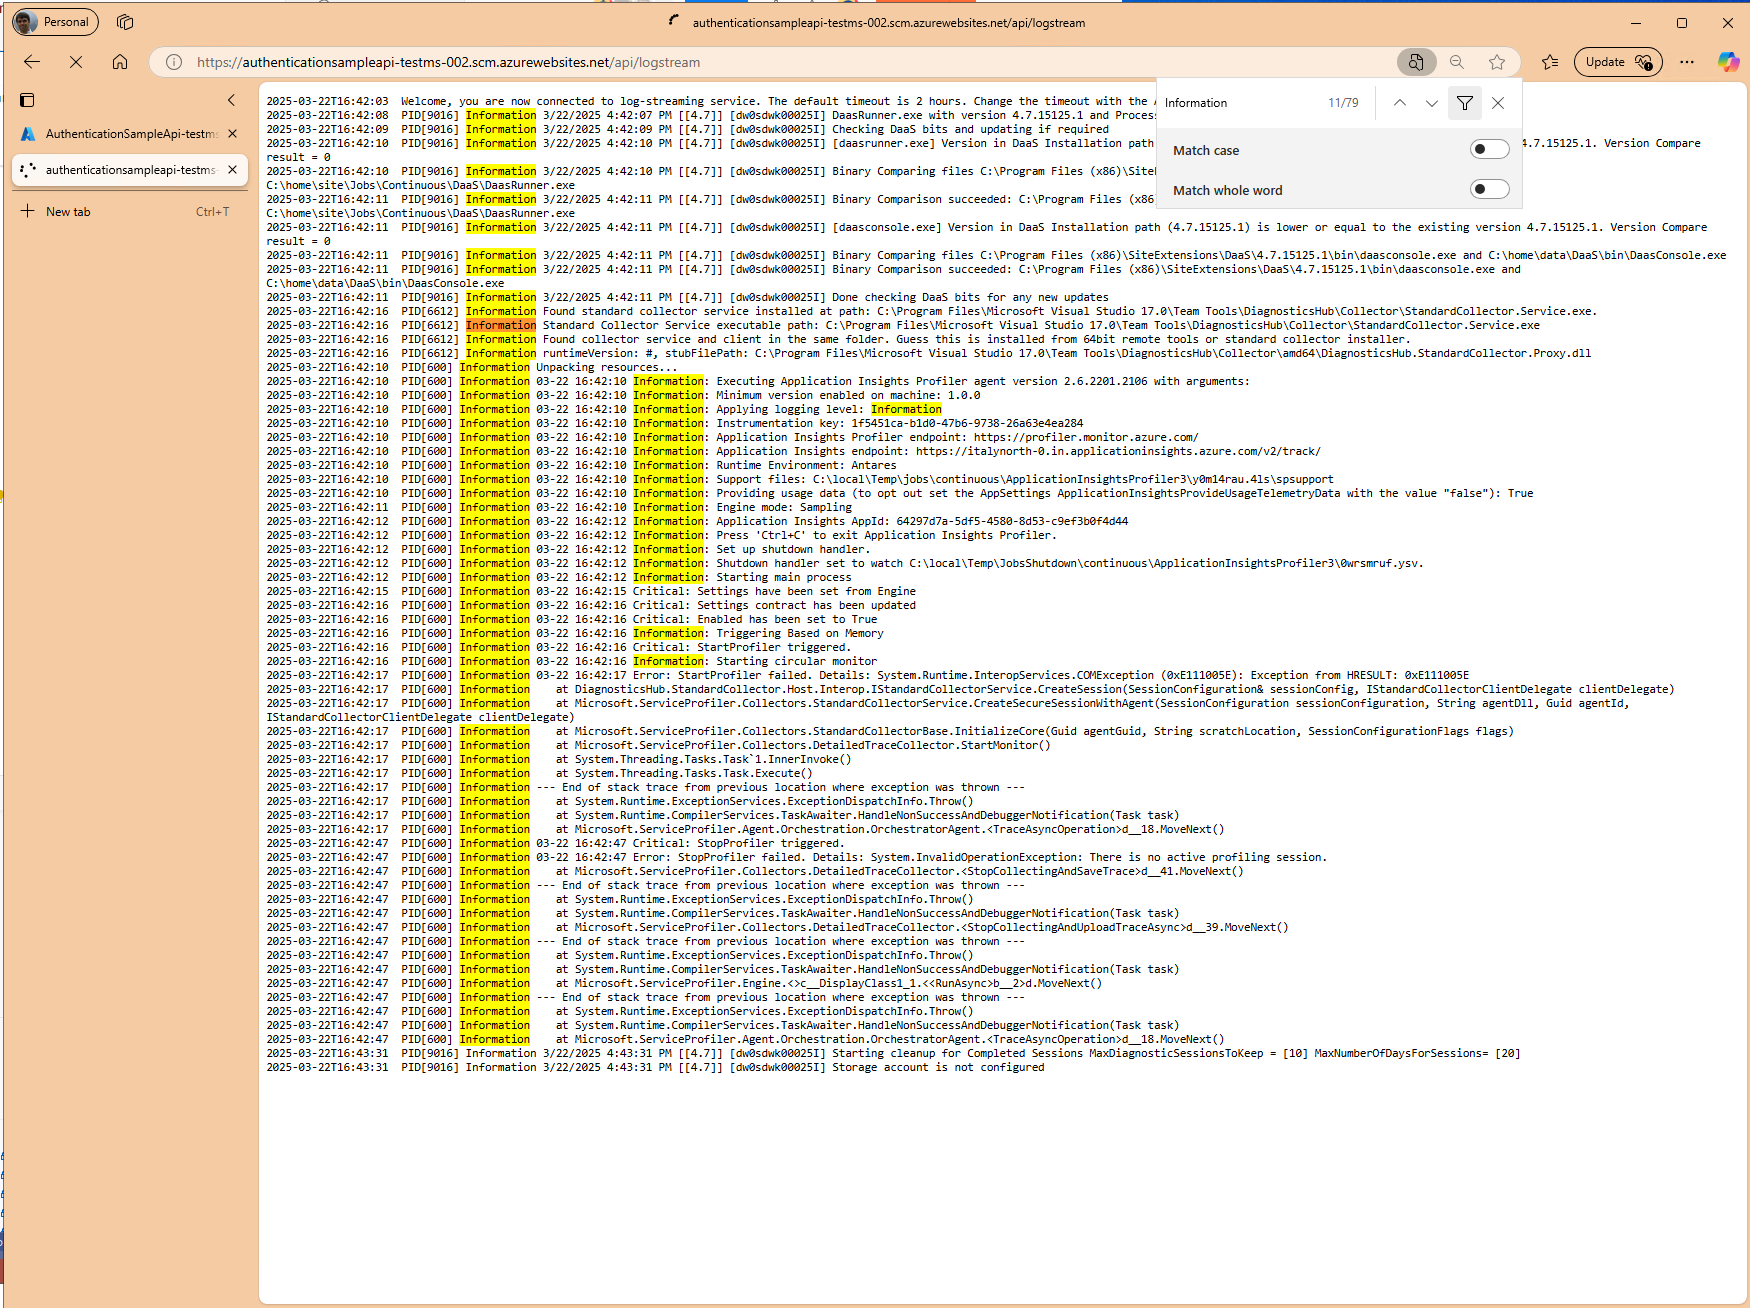
In case specific troubleshooting is needed for an application behaviour you can use dynamic logging to elevate application logging level for any logging category.
The image shows an example call to the server where LogLevel is elevated to Trace: 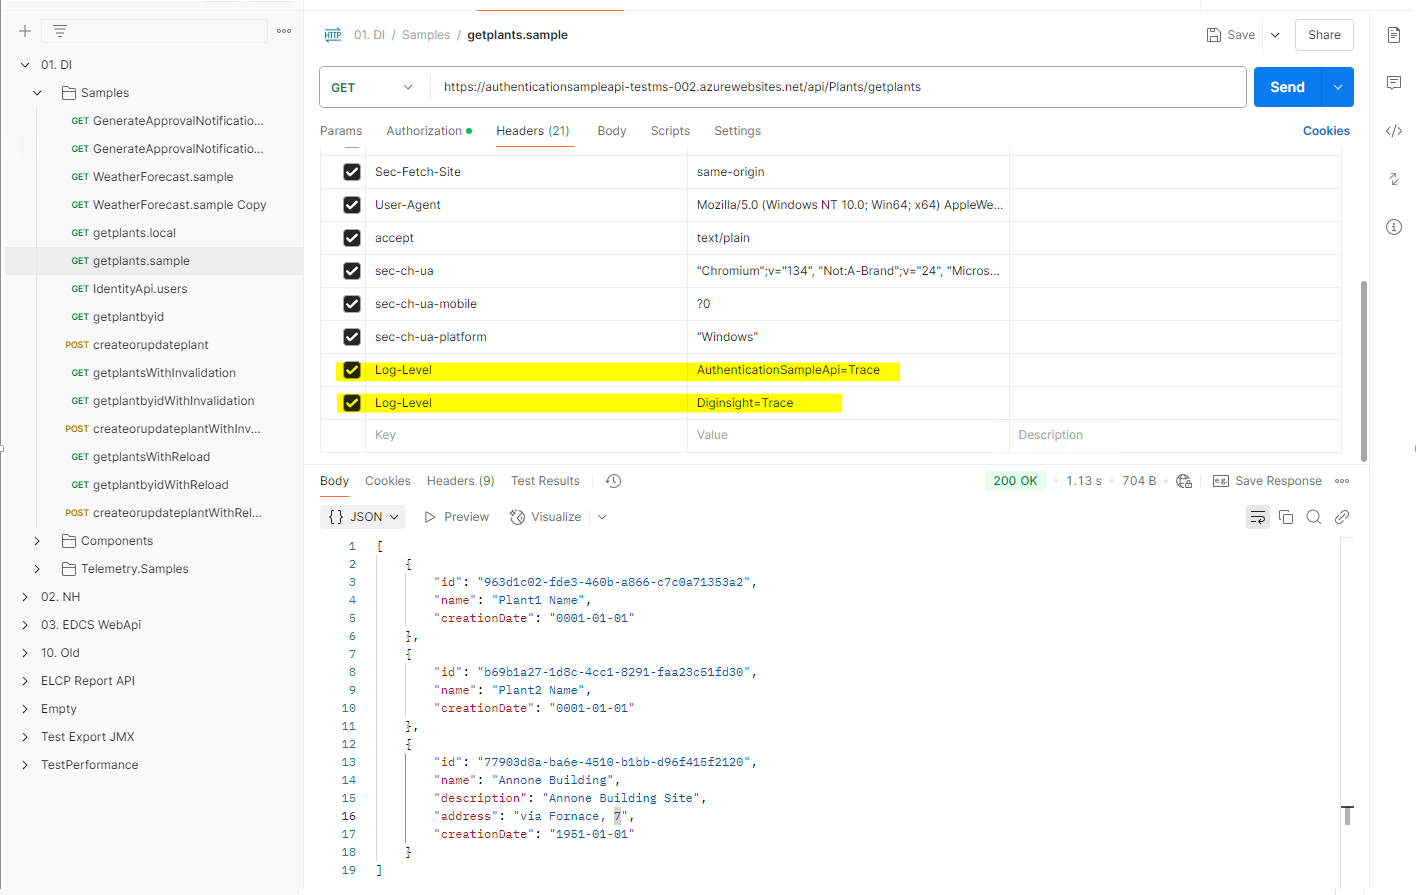
This will result in the full application flow being shown for the specific call: 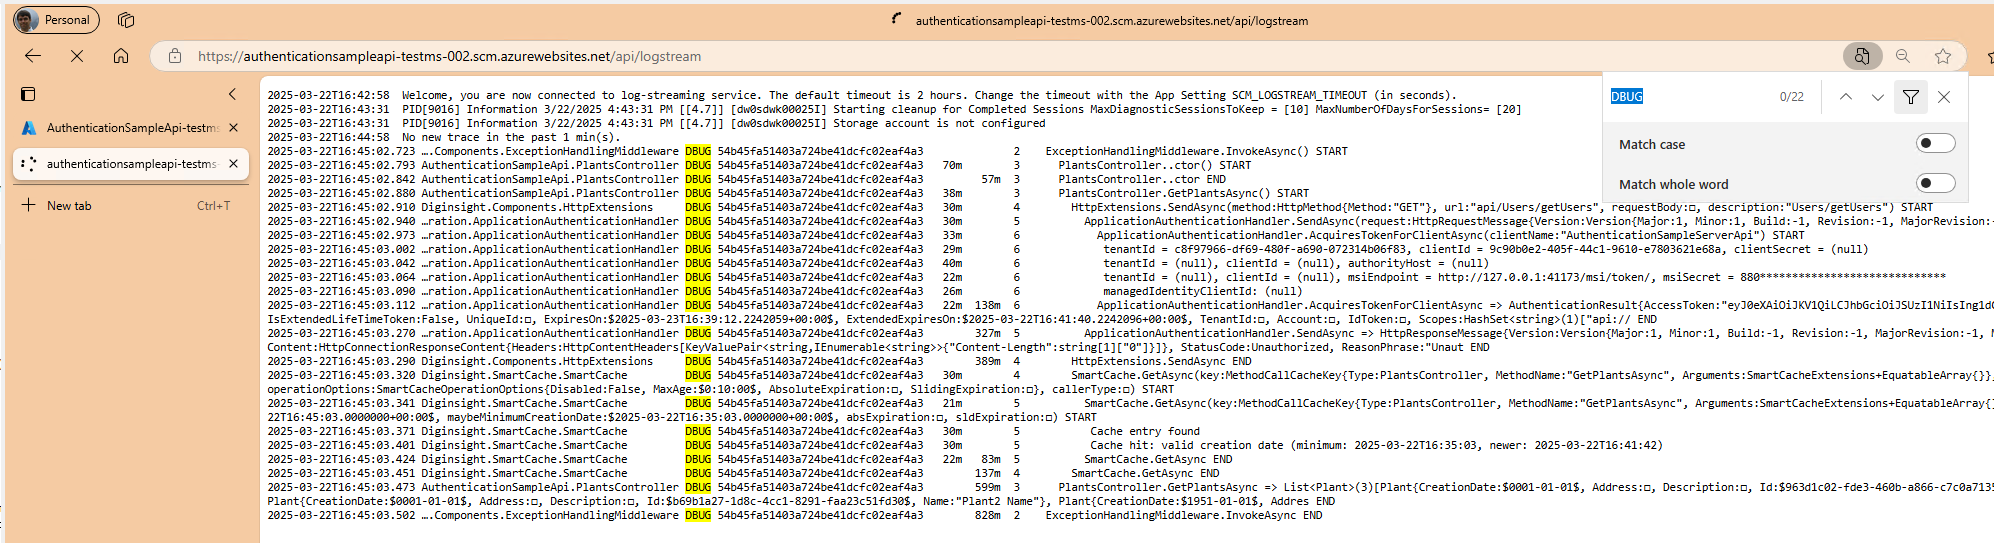
This way, a single call application flow can be easily isolated and analized on a live server, that is processing other calls at the same time.
Build and Test
Clone the repository, open and build solution Diginsight.sln. run EasySample and open the log file in your *** folder.
Contribute
Contribute to the repository with your pull requests.
License
See the LICENSE file for license rights and limitations (MIT).