HowTo: Use dynamic logging to manage loglevel dinamically, at runtime
diginsight telemetry supports dynamic logging to hot switch the minimum log level (e.g. from Information or Warning to Debug or Trace levels) of any log category.
To minimize telemetry cost and performance impact, telemetry sent to the remote tools is normally limited to LogLevels Critical, Warning or Information.
The snippet below shows a tipical Logging section configuration for a production environment:
"Logging": {
  "LogLevel": {
    "Default": "Information",
    "Microsoft": "Warning",
    "Microsoft.Hosting.Lifetime": "Information"
  }
}
Using Diginsight telemetry on a Web API or Web Application, the log level for any category can be overridden at runtime, for a single call, by means of the Log-Level http request headers.
Additional Information
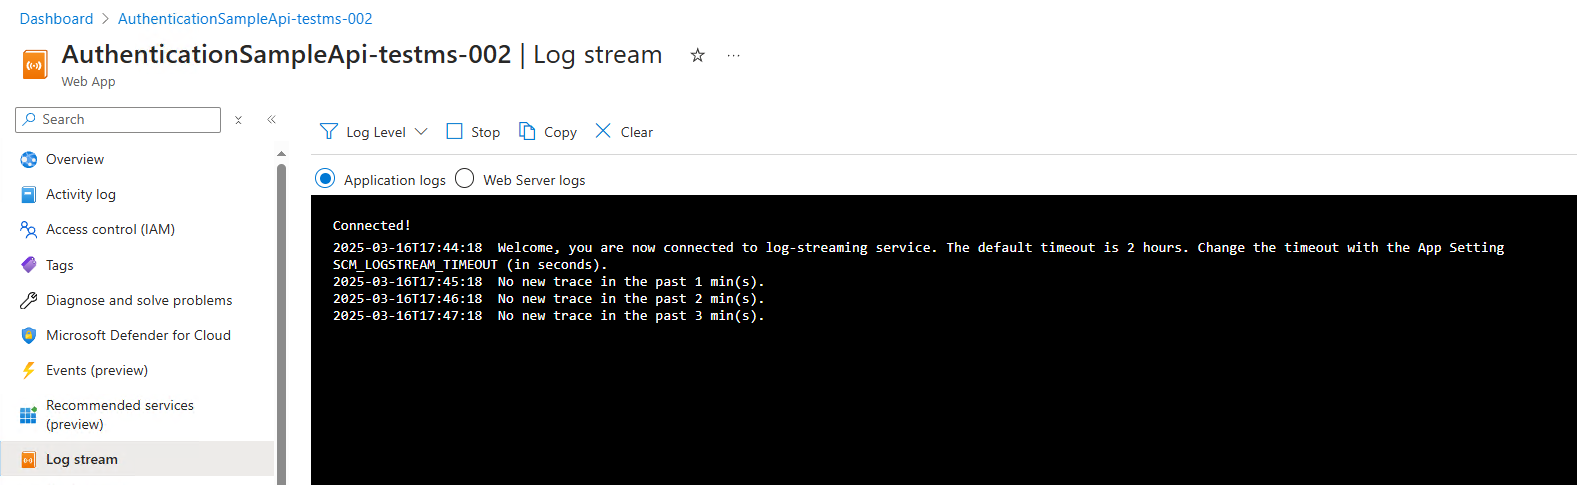
The image below shows the logstream for a web API where only Critical, Warning and Information and levels are enabled.
While the application is running the streaming log shows only limited (or no) information about the application execution flow.
In case we need to troubleshoot a specific application call flow, it is possible to reporduce the call specifying different log levels for some categories: 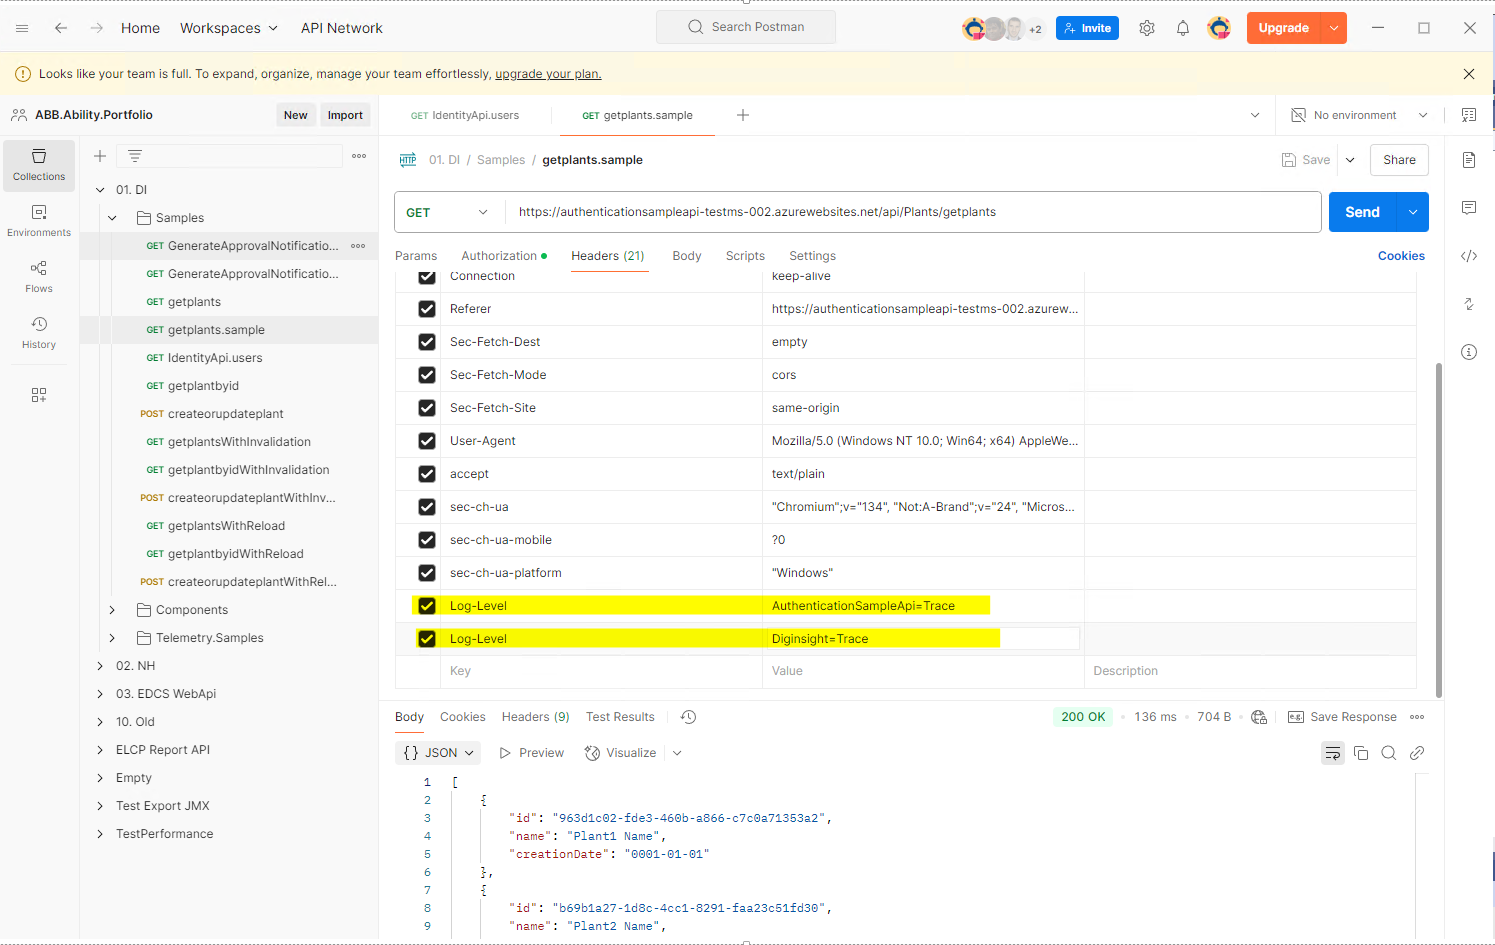
This will result in the full application flow being shown for the specific call: 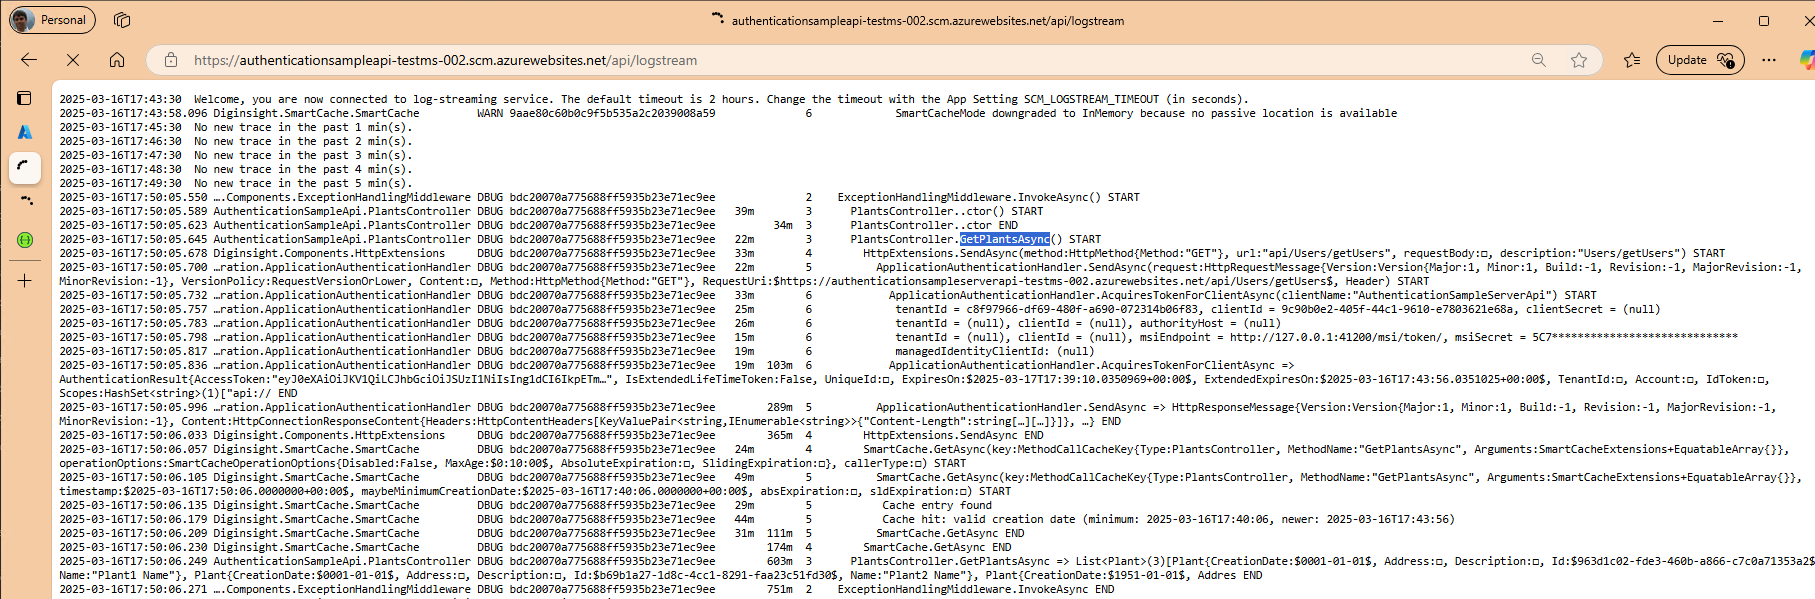
this way, every call application flow can be easily isolated and analized on a live server, that is processing other calls at the same time.
HowTo Enable Dynamic Loggging
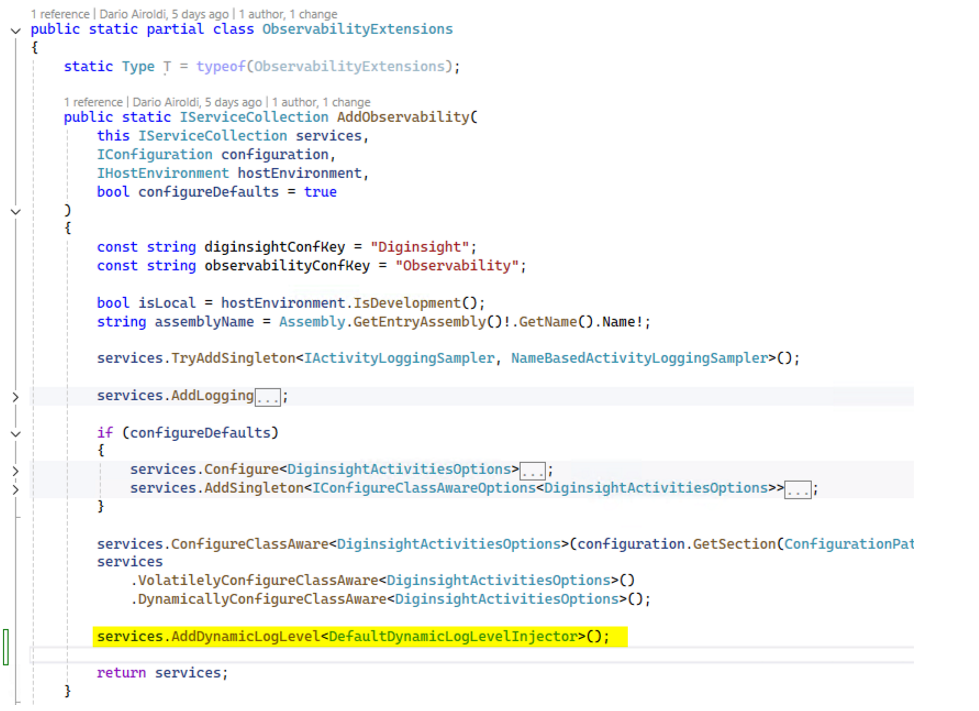
Dynamic logging can be enabled adding the following stagement:
services.AddDynamicLogLevel<DefaultDynamicLogLevelInjector>(); to the ConfigureServices methods, in the application startup sequence.
The image below shows that statement into startup sequence of the S01_00_SampleWebAPI project, within diginsight telemetry.samples repository: